Blog

us.jpg   fr.jpg

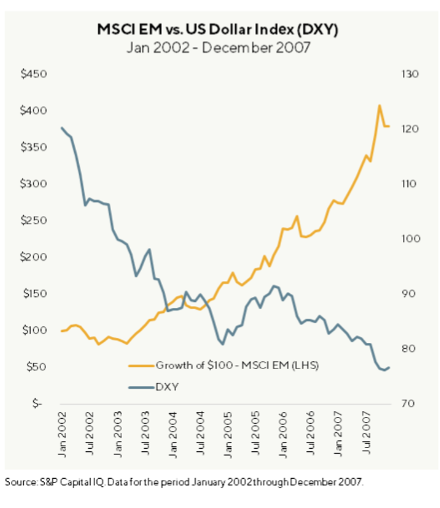
MSCI EM vs. US dollar index (DXY) January 2002-December 2007

Picture147.png

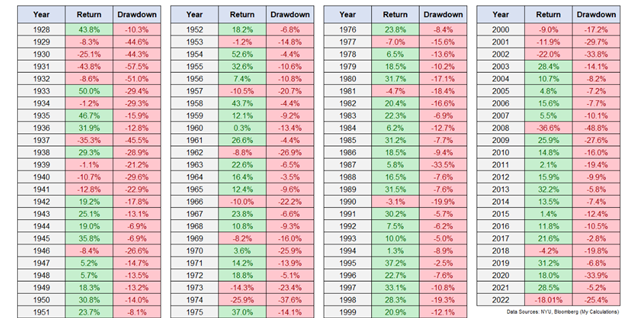
Returns and drawdowns since 1928

Picture146.png

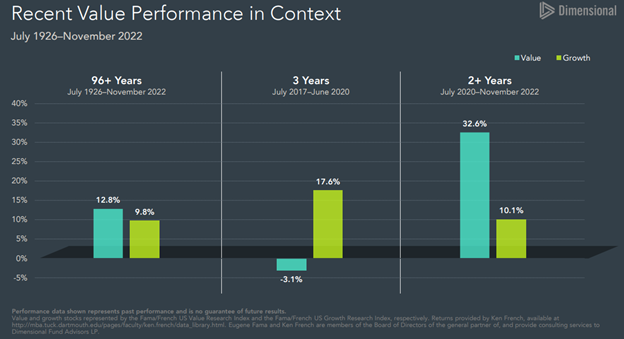
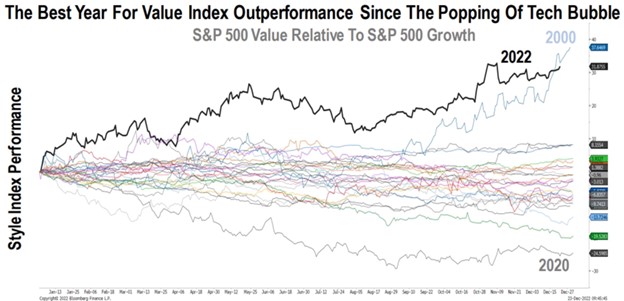
The best year for value index outperformance since the popping of the tech bubble

Picture145.jpg

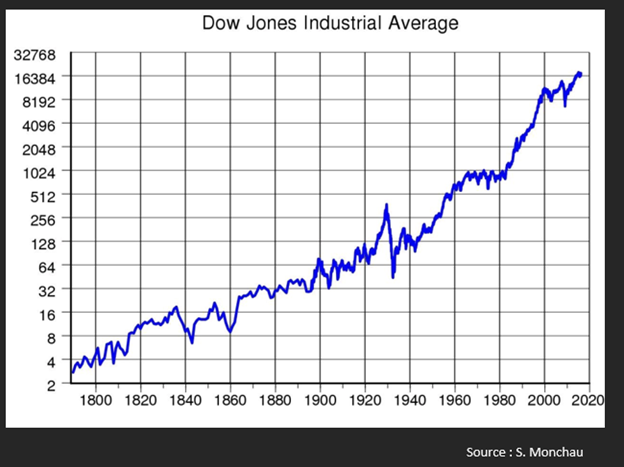
Dow Jones industrial average since 1780

Picture144.png

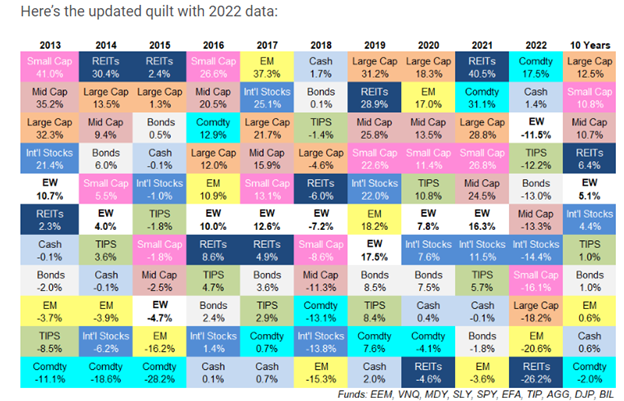
2013-2022 return quilt

Picture143.png

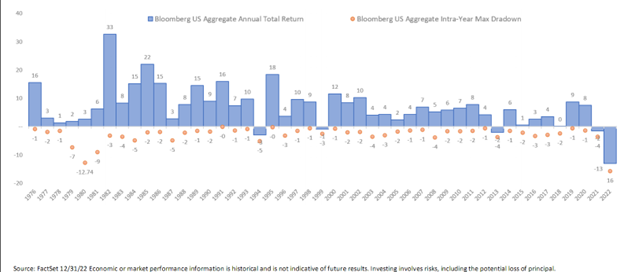
Bloomberg US aggregate annual total return vs. intra-year max drawdown since 1976

Picture141.png

MSCI indices relative price performance in local currency

Picture139.png

Total nominal return in US stocks & bonds, for each year since 1871

Picture138.png

Total nominal return in US stocks & bonds, for each year since 1871

Picture138.png

2022 return vs. previous worst-performing 12-mo period since 1842

Picture137.png

Syndicate content